


As investors, we are inundated by a dizzying array of ‘valuation’ multiples and metrics which can turn our decision-making into a tear-your-hair-out exercise of navigating complexity.
You can see a classic example of this in a recent Broker analysis as it presents its dataset of technology companies. Let’s start by looking at that.
Rank Confusion
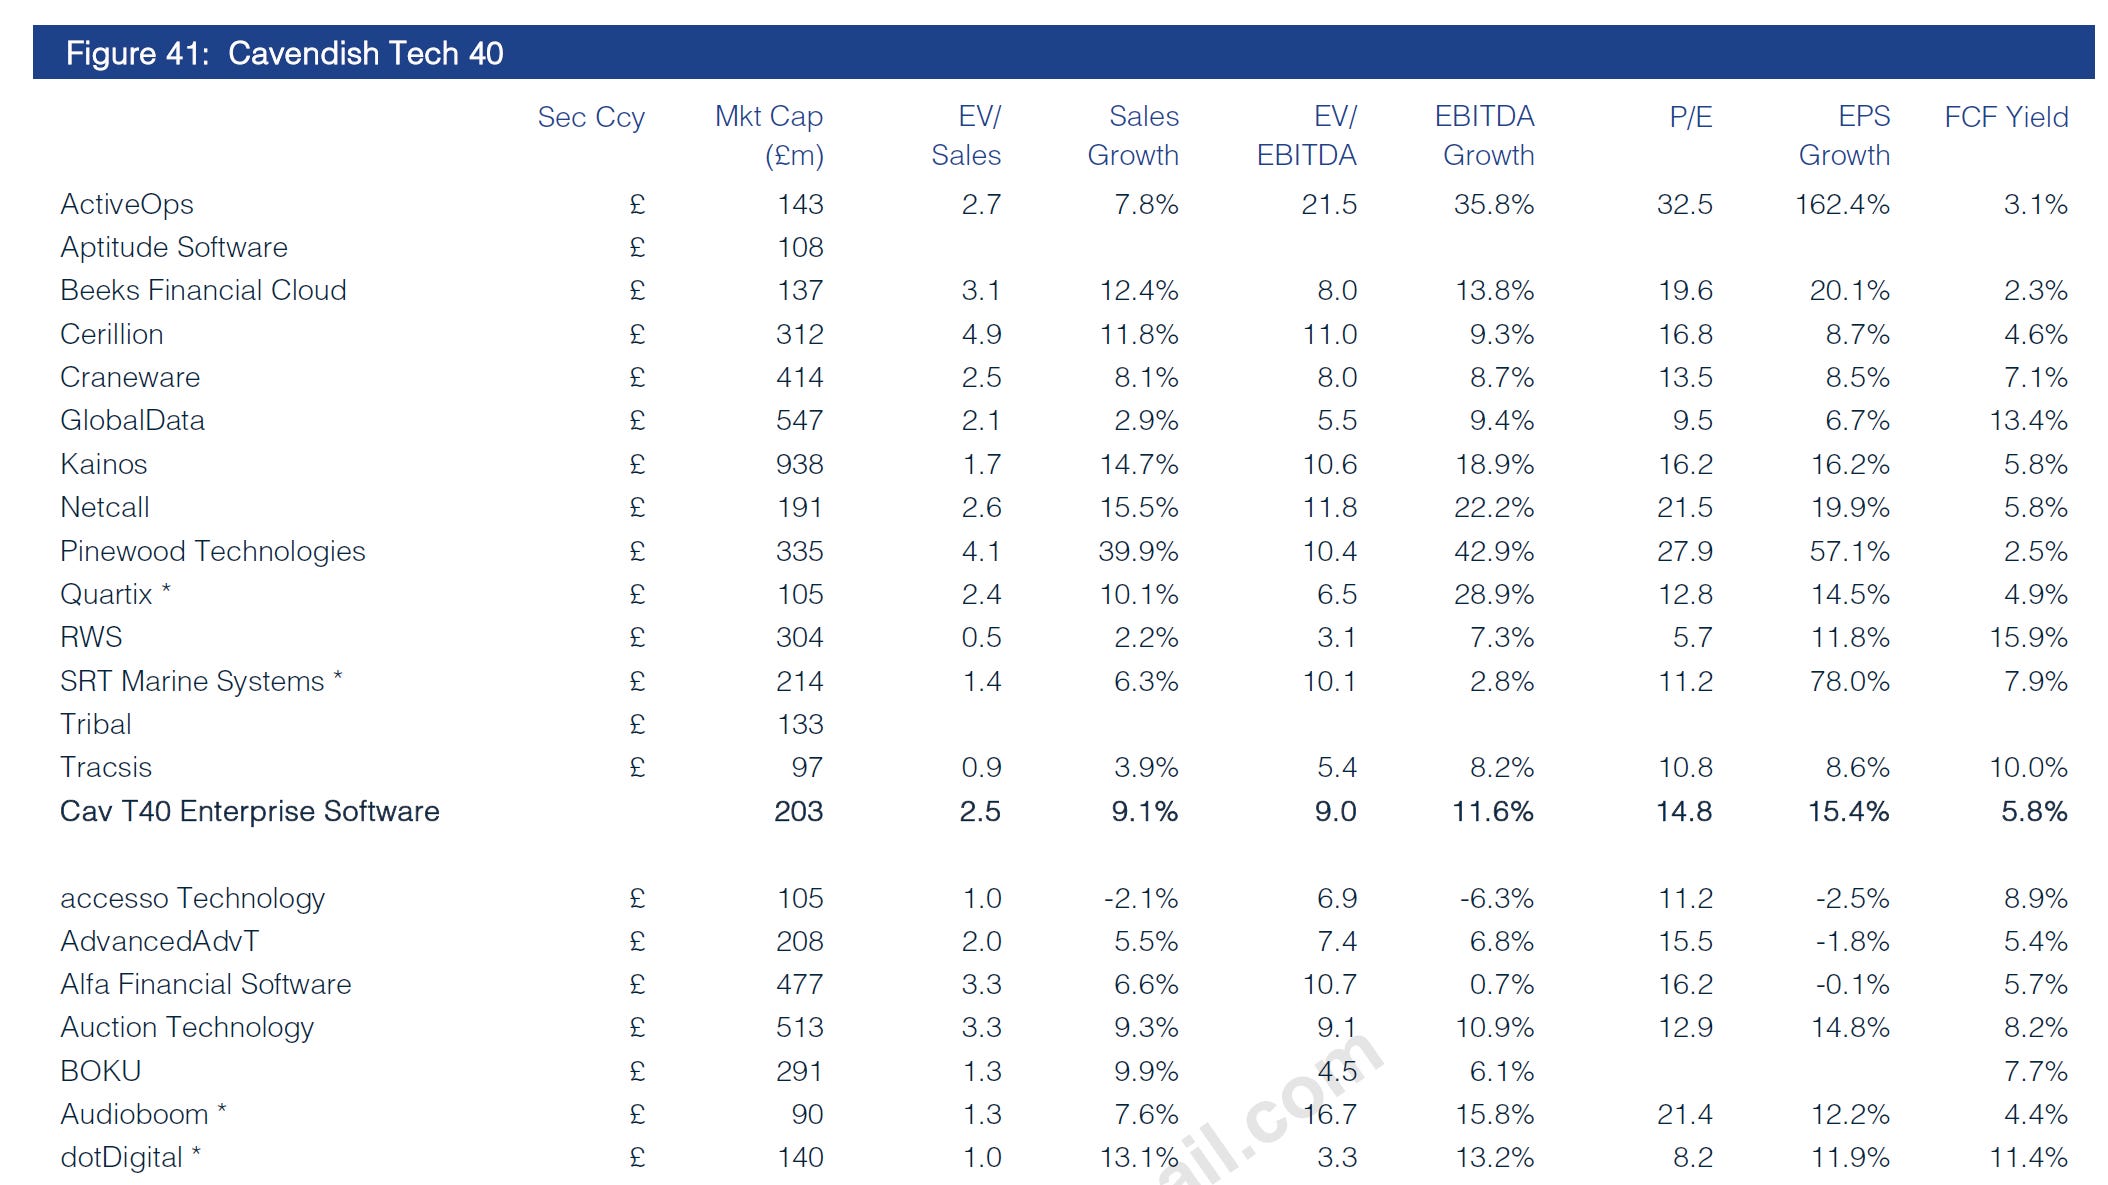
The question here is what do you go with? Do you put your money into GlobalData because of its 13.4% FCF yield? Do you invest in SRT Marine on the basis of its alluring P/E of 5.7? How about accesso Technology and its 1x EV/Sales ratio? Or do you pile in to Pinewood with its 42.9% EBITDA Growth?
I’m sure you will agree that this table, with its plethora of metrics, does nothing to dispel confusion or help clarify our decison-making. Far from it - arguably it creates even greater confusion.
These metrics are what valuation maestro Michael Mauboussin calls heuristics - convenient if flawed shorthands for value, and while not entirely useless, still pretty much so.
Add to that some of the underlying data are questionable measures of anything meaningful - for example Charlie Munger, never one to mince his words used to call EBITDA ‘bullshit earnings’.
Bullshit in, bullshit out. This doth not sound valuation make. So another consideration to add to our complexity and confusion. Do these broker metrics actually measure anything of, erm, value?
Moneyball
In the famous baseball movie Moneyball, we saw how Billy Beane (played by Brad Pitt) was faced by exactly the same conundrum we investors face today.
Moneyball, for the Wizard, is in our view the most valuable investment movie any investor can watch - and watch twice over at that.
The movie brings Beane’s conundrum to life - the good ole’ boys (scouts) bloviating about who the best baseball player is based on among other things, how pretty a player’s wife is.
With the help of Peter Brand (played by Jonah Hill) we see how Beane cut through the complexity and BS with just one number. This number (on base percentage) was obtained via rigorous processing of causally predictive player data and not biased reasoning or subjective intuitions in order to identify true value.
Bear in mind that Billy’s team (the Oakland A’s) were ‘the runt of the litter… the last dog at the bowl’ - does this sound at all familiar to us private investors up against behemoth Hedge Fund Managers and weight of Institutional Capital?
Using this robust and accurate data-driven approach enabled the Oakland A’s to gain a significant edge.
‘It’s about getting things down to one number. Using stats the way we read them, we’ll find value in players that nobody else can see…
‘People are overlooked for a variety of biased reasons and perceived flaws… Bill James and mathematics cut straight through that.’
Thus by deconstructing all the data variables and arranging these into causal priors, they arrived at just one number (just as we do with our predictive AI engine Wizard) to cut straight through the biases and BS to uncover extreme value disconnects. Have a watch:
Just One Number
This approach - of mathematics over intuition - worked. The Oakland A’s quite literally smashed their season out of the park. Within two years all the Major League baseball teams were using Bill James’ approach.
And it works in investment too. Here’s one of Wizard’s Winners. Hardide was identified by Wizard in October of last year, since when it has risen by over 840% in eight months - more than Nvidia during its halcyon rise.
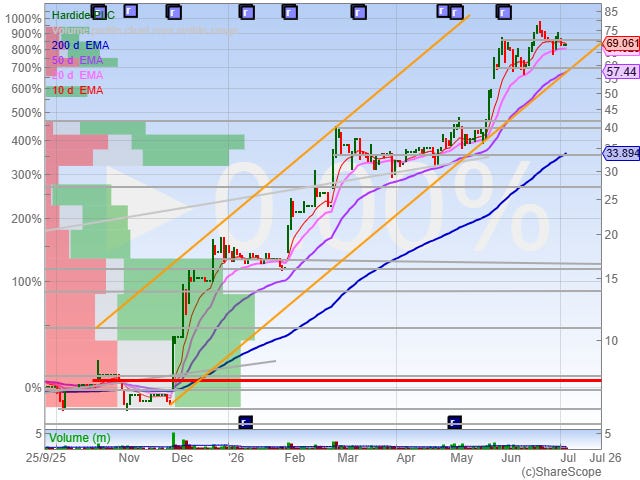
But here’s the thing. Even in March of last year I received no end of abuse about Hardide. It had gone nowhere for decades - a perennial ‘jam tomorrow’ stock, forever making promises and forever failing to live up to them. Here’s the chart as we entered 2026:
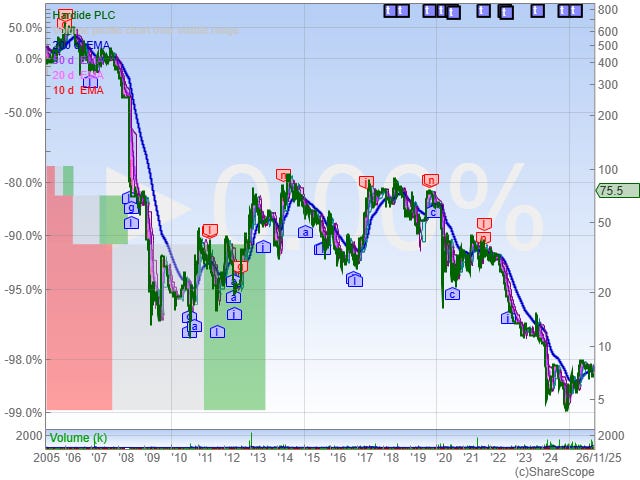
Why did Wizard like it then? Simply put, because the sum of future cashflows far outstripped its current Enterprise Value when the market was pricing it for bankruptcy and further failure, despite Hardide having cash in the bank and crossed the point of FCF inflection.
Back in October of last year (where the second chart ends), Wizard was already printing Hardide as a 6x. Further contract wins (the periodicity and probability Wizard also modelled) only added kerosene to Hardide’s afterburners. Thus Wiz’s 6x quickly became an 8x.
The single number Wizard uses is EV / NPV10, where Enterprise Value (EV) is the current price tag to buy the entire business outright today (including its debt) and where NPV10 is the total discounted cash that business will generate over the next ten years (or more if those cashflows can be modelled with a reasonable margin of accuracy, safety and appropriate discount rate).

Now without overly wizening you Wizards, you will see that underpinning this equation are Post-Tax FCFs - which is the key input we really care about.
Why FCFs and not our vaunted EBITDAs, Revenues, Net Profits, P/Es or PEGs or any other tool we might grab from the broker and analyst bag of spanners?
Because standard metrics are temporal, single-year snapshots. A stock may trade on a cheap P/E or EV/EBITDA today, but those metrics tell you nothing about the trajectory of the business. Further, the discipline of just one number means you cannot just invent cashflows - you have to be sure those cashflows are predictable. This means you need to make a robust analysis of a company’s quality and durability of product and service, customer engagement, moat and competitive landscape. On top of this EBITDA and such-like enable some companies to hide really important costs - such as capitalised operating expenses, capex, interest and working capital absorption - that materially impact its true value.
Hopefully this shows that taking the ‘bag of spanners’ approach to investing is woefully simplistic if not outright hazardous. Comparing companies on temporal and relative terms tells you nothing about the durability and predictability of each company’s unencumbered, post-tax Free Cashflows which is really all you need to care about.
We’ll come back to the primacy of Free Cashflows in a moment. But first…
A Sailor’s Analogy
Imagine for a moment you are sailing in a race from Lisbon to London.

You look out of your yacht and see this. Boats everywhere, with your goal being to get into as much wind pressure as possible. In this picture the crew can mostly see the wind, revealed by the ripples on the water. Or, by sticking a finger in the air.
But it’s pure madness to put faith in this method if you your goal is to get to London quickly (and safely). That’s why modern yachts are equipped with weather routing software.
These present the wind as it will be and over longer periods of time. We can see this through the major differences in the pressure bars (even to non-sailors) with less pressure in the Bay of Biscay (France/Spain) and more out in the Atlantic:
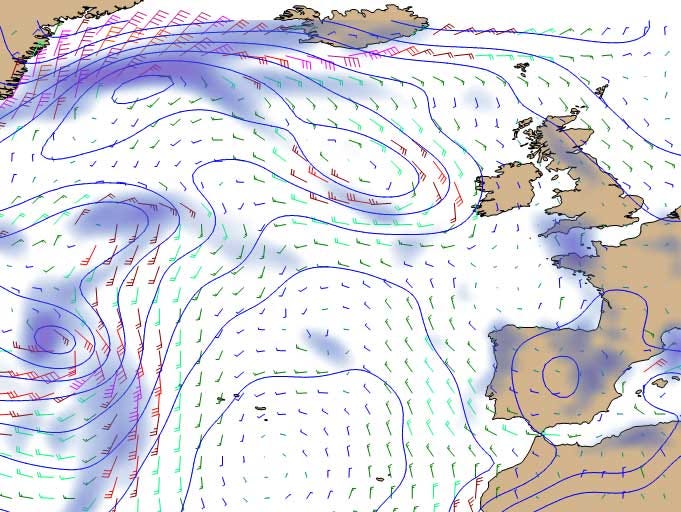
‘Pressure’ here can be equated to Free Cashflows. The more the better! Using this tool we can thus model the trajectory and speed of the boat (more or less) as it heads towards its destination and compute how much wind from which angle it might expect at any point - just like with a company’s cashflows.
The first way of divining the wind - head out of the boat or finger in the air - is not useless, but it is only temporal. It tells you little about what will happen even an hour out. The second is predictive and timely.
Guess which approach most investors rely on?
Oh, cashflows!
The concept of valuing a company based on the lifetime sum of its Free Cashflows is nothing new, and certainly not any invention by our erstwhile Wizard. If anything, he is but wearing borrowed clothes.
Nor is it a fringe belief or methodology. Some of the shrewdest investors and operators today shun every other metric in favour of Free Cashflows.
‘We don’t look at P/E ratios to decide whether to buy a stock. We look at the discounted value of the cash a business can generate over its life. P/E is an outcome, not a cause’.
Warren Buffett
‘Our ultimate financial measure, and the one we most want to drive over the long-term, is free cash flow per share.’
Jeff Bezos
‘The market is an expectations machine. Stock prices represent a set of expectations about a company's future cash flows.’
Michael Mauboussin
Charlie Munger meanwhile explains to us why a laser-like focus on Free Cashflows is non-negotiable…
‘There are two kinds of businesses: The first earns 12%, and you can take it out at the end of the year. The second earns 12%, but all the excess cash must be reinvested - there's never any cash. It reminds me of the guy who looks at all of his equipment and says, 'There's all of my profit.' We hate that kind of business.’
Charlie Munger
Wizard constructs all companies’ Free Cashflows using a forensic methodology (to return to Moneyball’s words) which cuts through the accounting and optical illusions businesses routinely present.
It’s for this reason that EBITDA (‘bullshit earnings’) is strictly banned from all Wiz’s computations and its lexicon. All Wiz really cares about is how much cash drops from the business into its bank account across its lifespan.
I’m sad to say that just as heuristics and intuition are shortcuts born of laziness, so too are metrics like EBITDA; they are simply fodder the commentariat uses to bedazzle investors and make themselves sound authoritative while saying little of any value.
North Star
Finally, there is one last critical advantage in pursuing our Just One Number approach. It’s this:
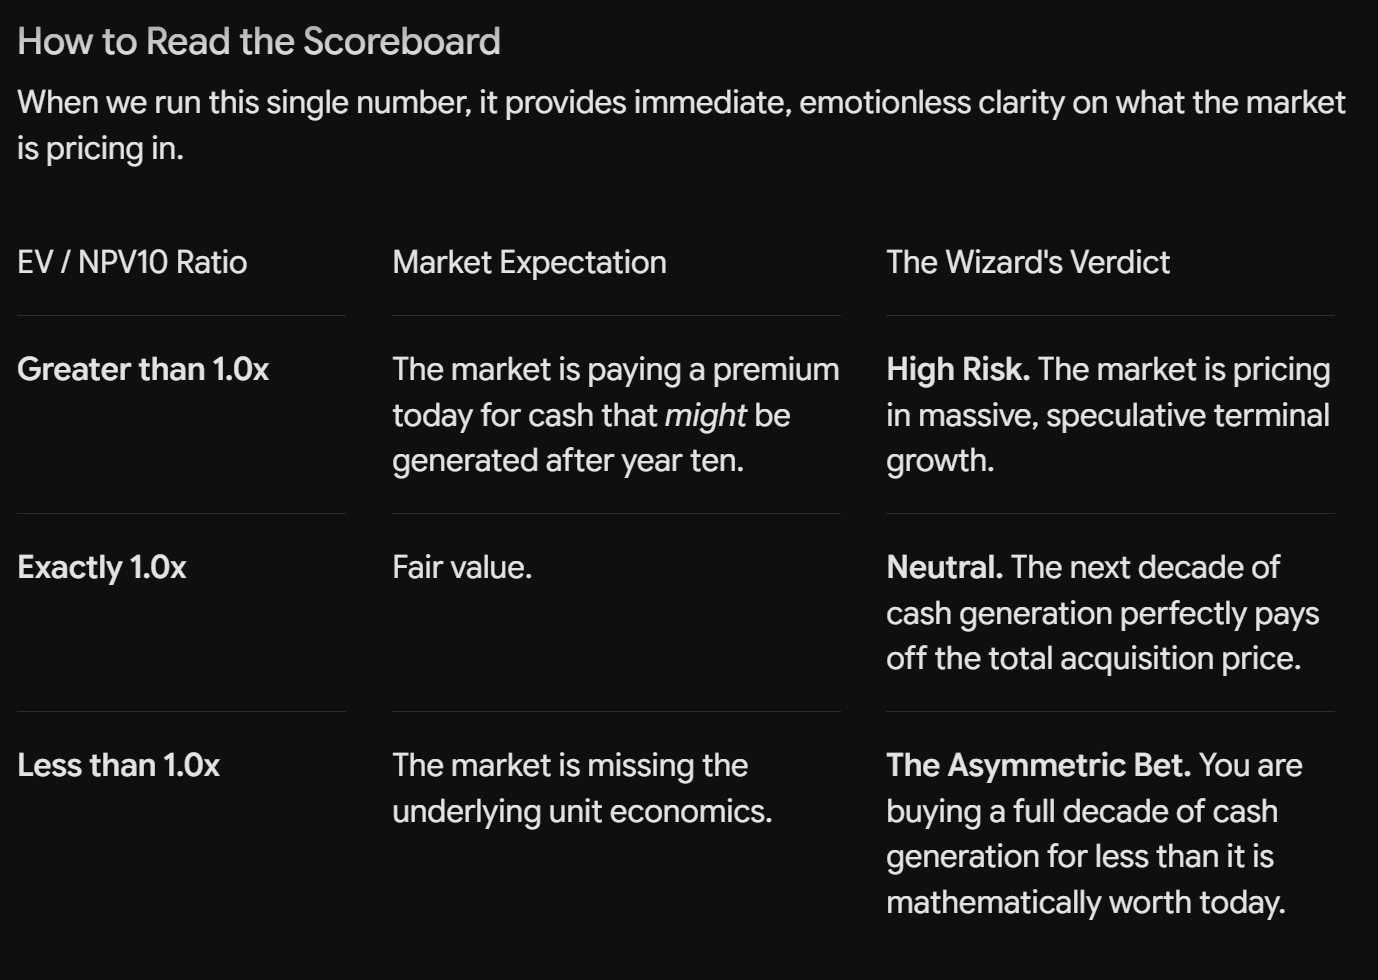
Put simply, any computation below 1 and the equity has upside (to Fair Value). Any above one and it is overvalued and it has downside. So far so good. Point to note though - the market is not very effective at identifying these valuation disconnects. A number of companies sit at 5 or 6x above or below Fair Value as I write. The market becomes more myopic the further the horizon stretches out.
Back to the Broker bag of spanners we presented you at the top of this article.
As I hope you by now agree, using their finger-in-the-wind methodology you can’t even value companies in the same industry like-for-like using their meaningless array of flawed and temporal metrics.
With just one number however, you can not only measure the valuations (and most importantly valuation disconnects) of companies in the same industry, but also between them in different industries.

This is why we can say that (for example) Filtronic has an 80% downside (ie it is overvalued by 5x based on its future sum-of-cashflows) while Audioboom conversely has 5x upside. This is why we can model a gold miner alongside say a microfinance provider - all relative to this one number.
As Alfred Rappaport frequently noted and as championed by Terry Smith, when we’re investing we’re not really buying a company or narrative, but the fractional claim on a company’s lifetime sum of free cashflows.
Just one number = a North Star then. This number not only cuts through the BS and biases, it also gives us a sound single yardstick to measure all companies by, thereby eliminating the complexity and confusion we encountered right at the start of this article.
Gaining our Edge
Just as in Moneyball, this discipline gives us our edge. It lets us identify our future Hardides when the market sneers at it, in the same way clubs sneered at Chad Bradford because he ‘throws funny’.
That’s good for us, as Brad Pitt says in the movie, we can get him cheap.
Yes, this does mean extra work. But when you can truly unearth hidden upside in multiples? … Now that’s Moneyball.
Thank you WOW, another really great article that cuts through all of the noise and points to the one true metric that we should all be basing our decisions on - Free Cash Flow and in particular identifying the FCF inflection point, very often the point at which the sp will start to motor. (Move over Barry Norman, as a pretty good film choice too...!!)